


Article content

Jovana Gojkovic
10 min read
Web scraping is a powerful technique that allows you to extract valuable data from websites, turning unstructured information into actionable insights. Whether you’re a beginner or an experienced developer, building hands-on scraping projects is a great way to sharpen your skills and create useful tools across various industries. In this article, we’ll explore practical web scraping project ideas to help you acquire more real-world website indexing skills.
Hotel Price Comparison Tool
A tool that scrapes hotel room rates from multiple booking platforms (e.g., Booking.com, Expedia, Airbnb) for the same city and date range. It helps travelers instantly spot the best deals without checking each site manually.
What you’ll scrape:
- Hotel name and address
- Room type and amenities
- Price per night
- Availability and booking conditions
- Guest rating and reviews
Tools & skills needed:
- Python with BeautifulSoup or Scrapy for data extraction
- Requests or httpx for HTTP handling
- Proxy services to avoid rate limits and geo-blocking (important for price variations by location)
- Optional: Pandas for data cleaning and Matplotlib/Plotly for visualization
Potential challenges:
- Some sites use dynamic JavaScript content — may require Playwright or Selenium
- CAPTCHA and anti-bot measures
- Differences in how platforms present amenities and price breakdowns
Extra features / enhancements:
- Geolocation testing – Scrape the same hotel from different IP locations to show regional price differences
- Historical price tracking – Store past data to visualize pricing trends over time
- Filtering & sorting – Let users filter by price range, amenities, or rating
| Hotel Name | Platform | Location of Request | Price (USD) | Rating |
|---|---|---|---|---|
| Barcelona Central Hotel | Booking.com | US IP | $128 | 8.5/10 |
| Barcelona Central Hotel | Booking.com | Spain IP | $120 | 8.5/10 |
| Barcelona Central Hotel | Expedia | US IP | $135 | 8.5/10 |
| Barcelona Central Hotel | Expedia | Spain IP | $127 | 8.5/10 |
| Barcelona Central Hotel | Airbnb | US IP | $140 | 8.5/10 |
| Barcelona Central Hotel | Airbnb | Spain IP | $133 | 8.5/10 |
Travelers booking from certain countries may see lower rates, especially for local IPs. This difference can be leveraged to save money or optimize travel budgeting.
Location and Platform Impact Hotel Room Prices: A Barcelona Case Study
Our data shows how hotel prices shift across locations and platforms. See what hotels and OTAs can learn from these real-world insights.
 Jan Wiśniewski
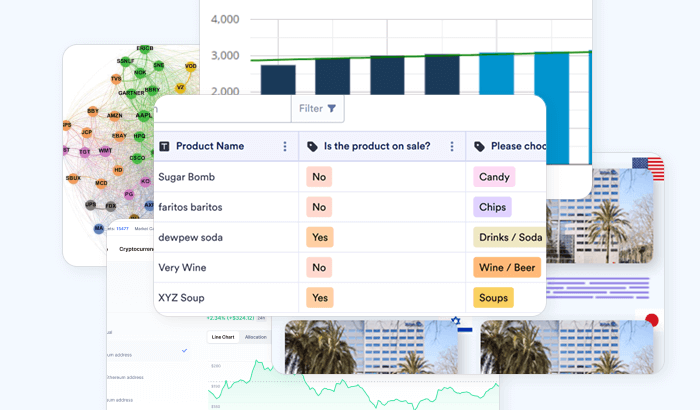
E-commerce Price Tracker
An application that scrapes product prices, discounts, and stock availability from online stores such as Amazon, eBay, and niche e-commerce sites. It allows users to track price changes over time, receive alerts when items go on sale, and make data-driven purchasing decisions.
What you’ll scrape:
- Product name and description
- Current price and any discount applied
- Stock status (in stock / out of stock)
- Product rating and number of reviews
- Seller name or vendor details
Tools & skills needed:
- Python with BeautifulSoup or Scrapy for HTML parsing
- Requests or httpx for fetching page content
- Proxy rotation to avoid rate limits or IP bans (especially with large platforms like Amazon)
- SQLite or PostgreSQL for storing historical data
- Optional: Matplotlib, Plotly, or Google Charts for visualizing price trends
Potential challenges:
- Dynamic content loading with JavaScript (may require Playwright or Selenium)
- Frequent HTML structure changes on e-commerce sites
- Anti-bot measures such as CAPTCHA or hidden honeypot fields
Extra features / enhancements:
- Email or Telegram alerts when prices drop below a certain threshold
- Historical trend graphs to visualize price fluctuations
- Multi-platform comparison to show where a product is cheapest
- Category filters for products (e.g., electronics, clothing, home appliances)
| Date | Platform | Price (USD) | Stock Status | Rating |
|---|---|---|---|---|
| Aug 1 | Amazon | $199 | In stock | 4.6/5 |
| Aug 1 | eBay | $185 | In stock | 4.5/5 |
| Aug 1 | Best Buy | $210 | In stock | 4.6/5 |
| Aug 8 | Amazon | $189 | In stock | 4.6/5 |
| Aug 8 | eBay | $182 | Low stock | 4.5/5 |
| Aug 8 | Best Buy | $205 | In stock | 4.6/5 |
Amazon offered the largest price drop during the 2-week period, while Best Buy consistently remained at the higher end. Tracking across multiple platforms helps identify the best time and place to buy.
Job Market Insights Dashboard
A dashboard that scrapes job postings from platforms like Indeed, LinkedIn, or Glassdoor to reveal hiring trends, salary ranges, and in-demand skills. It helps job seekers target their applications more effectively and allows HR teams to benchmark against competitors.
What you’ll scrape:
- Job title and company name
- Location (onsite, hybrid, remote)
- Posted date
- Salary range (if available)
- Required skills or qualifications
- Job description snippet
Tools & skills needed:
- Python with Scrapy or BeautifulSoup for scraping
- Pandas for data cleaning and analysis
- Plotly, Matplotlib, or Tableau for visualizing trends
- Proxy rotation to scrape at scale without being blocked
- Optional: Natural Language Processing (NLP) to extract skill keywords from descriptions
Potential challenges:
- Many job boards require authentication or use dynamic content (may need Playwright or Selenium)
- Salary info is often missing — may require inference from similar postings
- Frequent HTML structure changes and varying job description formats
Extra features / enhancements:
- Skill frequency heatmap to show the most requested skills in a certain field
- Salary trend graphs filtered by role or region
- Geographical job distribution maps
- Alerts for new postings that match a saved search
| Skill | % of Postings (US) | % of Postings (UK) | Typical Job Titles |
|---|---|---|---|
| Python | 42% | 38% | Data Scientist, Backend Engineer, ML Engineer |
| SQL | 35% | 33% | Data Analyst, BI Developer, Data Engineer |
| AWS | 28% | 24% | DevOps Engineer, Cloud Architect, Site Reliability Engineer |
| React | 26% | 29% | Frontend Developer, Full-Stack Engineer, UI Engineer |
| Docker / Containers | 21% | 19% | DevOps Engineer, Platform Engineer, Backend Engineer |
In this sample, Python and SQL dominate both markets, while React shows slightly higher share in the UK sample — possibly reflecting stronger front-end hiring in those postings. Cloud and container skills (AWS, Docker) are common in both markets, highlighting the continued demand for cloud-native expertise. Use similar tables in your dashboard to surface regional skill differences and help job seekers prioritize learning.
Event Aggregator
A platform that scrapes upcoming concerts, conferences, festivals, and local meetups from ticketing and event websites. It compiles them into one central list, saving users from having to check multiple sources and making event discovery easier.
What you’ll scrape:
- Event name and description
- Date and time
- Venue name and address
- Ticket price and availability
- Event category (music, tech, sports, etc.)
- Event link for booking
Tools & skills needed:
- Python with BeautifulSoup or Scrapy for scraping event listings
- Playwright or Selenium for sites with dynamic content
- Pandas for data cleaning and deduplication (events often appear on multiple sites)
- Proxy rotation to avoid IP blocks from frequent requests
- Optional: Leaflet.js or Google Maps API to map event locations
Potential challenges:
- Duplicate events across multiple platforms
- Inconsistent date and time formats
- Frequent updates to event listings — requires scheduled scraping or APIs
- Sites with anti-bot measures (CAPTCHA, JavaScript rendering)
Extra features / enhancements:
- Category filters so users can find events by interest
- Interactive maps showing event locations
- Email or push notifications for events that match saved preferences
- Social sharing for quick promotion of events
| Date & Time | Event | Source | Venue | City | Price | Category | Link |
|---|---|---|---|---|---|---|---|
| Sep 5, 2025 — 20:00 | Indie Nights — The Echoes | TicketMaster | Riverside Hall | Stockholm | $28 | Music | View |
| Sep 8, 2025 — 09:30 | Nordic Dev Summit | Eventbrite | Tech Arena | Stockholm | $120 | Conference | View |
| Sep 12, 2025 — 18:00 | Open-Air Film: Classic Comedies | LocalCouncil | Central Park Lawn | Stockholm | Free | Film | View |
| Sep 14, 2025 — 19:00 | Culinary Pop-Up: Vegan Street | Meetup | Market Square | Stockholm | $12 | Food | View |
| Sep 20, 2025 — 10:00 | City Marathon — 10K Charity Run | OfficialSite | Harborfront | Stockholm | $35 | Sports | View |
| Sep 25, 2025 — 21:00 | Late Night Comedy — Laugh Lab | StubHub | The Laugh House | Stockholm | $20 | Comedy | View |
Aggregating events from multiple sources helps eliminate duplicates and fills gaps when one platform lacks certain categories (e.g., free local council events). For production use, implement deduplication (match by title, date, and venue), normalize date/time formats, and keep scraping schedules frequent enough to capture last-minute ticket updates or cancellations. Consider offering category filters, location-based sorting, and calendar export (iCal) as next-step features.
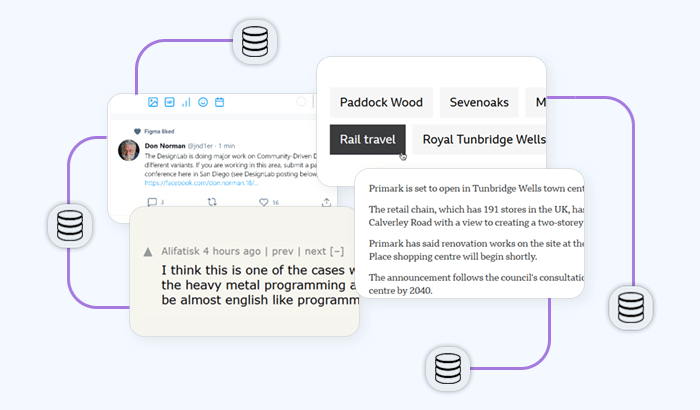
News Sentiment Tracker
A tool that scrapes news headlines, summaries, and publishing dates from major news websites or aggregators to analyze the sentiment (positive, negative, neutral) around specific topics. This helps users monitor public opinion trends, detect emerging issues, or track brand reputation over time.
What you’ll scrape:
- Headline and subheadline
- Article summary or snippet
- Publishing date and time
- Source publication
- Topic tags or categories (if available)
Tools & skills needed:
- Python with BeautifulSoup or Scrapy for scraping news sites
- News APIs (optional) for easier and legal access
- Natural Language Processing (NLP) libraries like TextBlob, VADER, or transformers for sentiment analysis
- Pandas for data organization
- Plotly, Matplotlib, or Dash for visualizing sentiment trends over time
Potential challenges:
- Frequent updates and rapid publishing cycles requiring timely scraping
- Variations in article structure across different news sites
- Handling paywalls or restricted content
- Differentiating between factual reporting and opinion pieces for accurate sentiment
Extra features / enhancements:
- Sentiment trend graphs showing how public mood shifts on a topic over days or weeks
- Topic clustering to group related news articles
- Alerts for sudden spikes in negative or positive sentiment
- Source comparison to see how different outlets cover the same topic
| Date | Headline | Source | Sentiment | Sentiment Score |
|---|---|---|---|---|
| Aug 10, 2025 | Renewable Energy Investments Reach Record High | GreenTech Daily | Positive | 0.85 |
| Aug 11, 2025 | Concerns Raised Over Wind Farm Impact on Wildlife | Nature Watch | Negative | -0.65 |
| Aug 12, 2025 | Government Unveils New Solar Power Incentives | Energy News | Positive | 0.78 |
| Aug 13, 2025 | Debate Continues Over Renewable Energy Costs | Financial Times | Neutral | 0.05 |
| Aug 14, 2025 | Local Communities Benefit from New Green Projects | Community Voice | Positive | 0.62 |
This sample shows mostly positive sentiment towards renewable energy news, with occasional concerns highlighted. Tracking such sentiment trends can provide valuable insights for policymakers, investors, and the public.
Crypto Price & News Tracker
A platform that scrapes cryptocurrency prices, trading volumes, and related news articles from exchanges and crypto news sites. This combined financial and sentiment data helps traders and enthusiasts make informed decisions in a highly volatile market.
What you’ll scrape:
- Cryptocurrency name and symbol (e.g., Bitcoin, BTC)
- Current price, 24-hour high/low, and volume
- Market capitalization and circulating supply
- News headlines, summaries, and publishing dates related to cryptocurrencies
- Sentiment or tone of news articles (optional)
Tools & skills needed:
- Python with Requests and BeautifulSoup or Scrapy for scraping
- APIs from exchanges like CoinGecko or Binance (often preferable for price data)
- NLP libraries like VADER or TextBlob for sentiment analysis on news
- Plotly, Matplotlib, or Dash for interactive charts
- Proxy services to handle request limits and geo-restrictions
Potential challenges:
- Frequent API rate limits and strict access rules
- Dynamic content and JavaScript-heavy pages on news sites
- Rapid market changes requiring near real-time data fetching
- Differentiating credible news from rumors or misinformation
Extra features / enhancements:
- Price alert system when cryptocurrency crosses specified thresholds
- Correlation charts between price changes and news sentiment
- Historical price charts with overlays of major news events
- Multi-coin tracking and portfolio management features
| Exchange | Price (USD) | 24h High | 24h Low | Volume (24h) |
|---|---|---|---|---|
| Binance | $29,850 | $30,200 | $29,300 | $18.5B |
| Coinbase Pro | $29,870 | $30,210 | $29,320 | $7.9B |
| Kraken | $29,830 | $30,190 | $29,290 | $3.5B |
| Date | Headline | Source | Sentiment | Score |
|---|---|---|---|---|
| Aug 10, 2025 | Bitcoin Hits New Support Level After Market Volatility | CryptoWatch | Neutral | 0.10 |
| Aug 11, 2025 | Ethereum Network Upgrade Receives Positive Community Feedback | BlockNews | Positive | 0.75 |
| Aug 12, 2025 | Concerns Over Regulatory Crackdowns Shake Crypto Markets | FinTech Daily | Negative | -0.60 |
| Aug 13, 2025 | New DeFi Project Promises Increased Security and Transparency | CryptoInsider | Positive | 0.82 |
Prices for Bitcoin show slight variation across exchanges due to market dynamics and liquidity. The news sentiment ranges from positive community updates to concerns over regulation, reflecting the volatile and multifaceted nature of the crypto market.
Social Media Hashtag Tracker
A tool that scrapes posts, tweet counts, and engagement metrics related to specific hashtags across platforms like Twitter, Instagram, and TikTok. This helps marketers, influencers, and researchers track trending topics, campaign reach, and audience sentiment in real time.
What you’ll scrape:
- Hashtag usage counts over time
- Post content snippets or captions
- User handles and follower counts (where available)
- Likes, comments, and share counts
- Posting date and time
Tools & skills needed:
- APIs like Twitter API, Instagram Graph API (preferred for legality and reliability)
- Python with Tweepy or Requests for scraping (where API access is limited)
- BeautifulSoup or Selenium for platforms with dynamic content
- Pandas for data analysis and aggregation
- Visualization libraries like Plotly or Matplotlib for trend graphs
Potential challenges:
- Strict rate limits and privacy rules on social media APIs
- Frequent UI and API changes that can break scrapers
- Handling large volumes of data efficiently
- Distinguishing between organic posts and bots or paid promotions
Extra features / enhancements:
- Trend heatmaps showing hashtag popularity by region or time
- Sentiment analysis on posts to gauge audience mood
- Influencer identification by engagement metrics
- Alert system for sudden spikes or drops in hashtag use
| Platform | Posts Count (Last 7 Days) | Average Likes | Average Comments | Top User Handle |
|---|---|---|---|---|
| 12,450 | 85 | 12 | @GreenGuru | |
| 27,800 | 320 | 45 | @EcoLover | |
| TikTok | 19,600 | 540 | 78 | @SustainableSam |
Instagram and TikTok show higher average engagement per post compared to Twitter for the #EcoFriendly hashtag, reflecting platform-specific user behavior. Tracking such metrics helps marketers tailor campaigns to the most effective channels.
Frequently Asked Questions
Python is the most popular choice due to its powerful libraries like BeautifulSoup, Scrapy, and Selenium. Other languages like JavaScript, Ruby, and R are also used, but Python offers simplicity and a strong community.
Web scraping legality varies by website and jurisdiction. Always check a site’s terms of service and robots.txt file. Use data ethically, avoid scraping personal or sensitive info, and prefer official APIs when available.
Use proxy rotation, respect rate limits, add delays between requests, and mimic human browsing patterns. Avoid aggressive scraping and use tools like headless browsers to reduce the risk of detection.
Yes. For websites loading content via JavaScript, use tools like Selenium, Playwright, or Puppeteer, which render the page like a browser, enabling you to extract dynamic content effectively.
Clean and normalize scraped data using libraries like Pandas. Implement robust parsing to handle date/time formats, missing values, and varying HTML structures to ensure your dataset is reliable and analysis-ready.


