


Article content

Jan Wiśniewski
6 min read
In today's data-driven world, the quality of data plays a crucial role in deriving meaningful insights and making informed decisions. Raw data is often messy, containing missing values, duplicate records, inconsistencies, and outliers – so, before performing any analysis, it is essential to clean and preprocess the data to ensure its accuracy and reliability. In this article, we’ll take a closer look at using Python libraries for making scraped data cleaner and better-organized.
Power of Python
Data cleaning and manipulation are fundamental steps in data science, business analytics, and machine learning workflows: Poor-quality data can lead to incorrect conclusions, inefficient models, and flawed business strategies – and by applying appropriate data cleaning techniques, we can improve data integrity.
Python Web Crawlers : Extensive Overview of Crawling Software | Infatica
Over the years, Python community has produced a plethora of great tools for web crawling and web scraping. In this article, we’ll explore these tools and analyze their most optimal usage scenarios.
 Denis Kryukov
There is a plethora of programming languages we can use for data manipulation and cleaning, but Python can arguably be the best option thanks to its powerful libraries like Pandas, NumPy, and SciPy. These libraries provide robust tools for handling missing values, removing duplicates, normalizing data, and more.
1. Setting Up the Environment
Before diving into data manipulation and cleaning, it is important to set up a proper working environment. Python provides a rich ecosystem of libraries that make data handling efficient and streamlined.
1.1 Installing Required Libraries
To get started, let’s install essential libraries such as Pandas, NumPy, and SciPy. You can install them using the following command:
pip install pandas numpy scipyAdditionally, you may want to install missingno for visualizing missing data and matplotlib or seaborn for data visualization:
pip install missingno matplotlib seaborn1.2 Loading a Dataset
Once the necessary libraries are installed, you can load your dataset to work with. For example, you can load a dataset from a CSV file using Pandas:
import pandas as pd
df = pd.read_csv("sample_data.csv")
print(df.head())
If you don't have a dataset, you can use publicly available datasets from sources like Kaggle or UCI Machine Learning Repository.
1.3 Understanding the Dataset
Before performing any cleaning, it is essential to understand the structure of the dataset. The following commands help you get an overview.
Check basic information:
df.info()Display summary statistics:
df.describe()Check for missing values:
df.isnull().sum()2. Handling Missing Data
Missing data is a common issue in datasets and can significantly impact the quality of analysis and machine learning models. Let’s explore different techniques for detecting and handling missing values using Pandas.
2.1 Identifying Missing Values
Before addressing missing values, it is crucial to identify them. You can use the following methods to detect missing values:
df.isnull().sum()Visualize missing values using missingno:
import missingno as msno
msno.matrix(df)
2.2 Handling Missing Values
Once missing values are identified, different strategies can be applied to handle them. For example, we can remove missing values – If a column or row contains too many missing values, it might be best to drop it:
df.dropna(inplace=True)Alternatively, we can replace missing values using different techniques such as mean, median, or mode imputation. Fill missing values with the column mean:
df.fillna(df.mean(), inplace=True)Fill missing values with the column median:
df.fillna(df.median(), inplace=True)Fill missing values with the most frequent value:
df.fillna(df.mode().iloc[0], inplace=True)When replacing missing values, we can perform forward and backward fill specifically. Forward fill:
df.fillna(method='ffill', inplace=True)Backward fill:
df.fillna(method='bfill', inplace=True)2.3 Best Practices for Handling Missing Data
- Always visualize missing data before applying any cleaning techniques.
- Use domain knowledge to determine the best method for handling missing values.
- Consider the impact of removing or imputing data on your analysis.
- Document your data-cleaning steps to ensure reproducibility.
3. Removing Duplicates and Handling Inconsistencies
Duplicate records and inconsistencies in data can distort analysis and lead to incorrect conclusions. Let’s explore methods to identify and eliminate duplicate records and address inconsistencies.
3.1 Identifying and Removing Duplicates
Duplicates can arise due to multiple data sources, entry errors, or merging datasets. To check for duplicate rows, run this command:
df.duplicated().sum()Display duplicate rows:
df[df.duplicated()]Remove duplicate rows from the dataset:
df.drop_duplicates(inplace=True)3.2 Handling Inconsistencies in Data
Data inconsistencies often occur due to variations in formatting, typos, or inconsistent categorical values. Common techniques to resolve inconsistencies include:
Converting text to lowercase:
df['column_name'] = df['column_name'].str.lower()Stripping whitespace:
df['column_name'] = df['column_name'].str.strip()4. Data Type Conversions and Formatting
Data often comes in different formats, and ensuring consistency is crucial for accurate analysis. Let’s see how to convert data types and format column names for better readability.
4.1 Converting Data Types
Inconsistent data types can cause errors in calculations and data processing. Here are a few common conversions:
Convert string column to datetime:
df['date_column'] = pd.to_datetime(df['date_column'])Convert categorical data to numerical using Label Encoding:
from sklearn.preprocessing import LabelEncoder
encoder = LabelEncoder()
df['category_column'] = encoder.fit_transform(df['category_column'])
Convert string column to numeric (handling errors):
df['numeric_column'] = pd.to_numeric(df['numeric_column'], errors='coerce')4.2 Formatting Column Names
By ensuring proper data type conversions and formatting, you can improve the quality and usability of your dataset. To improve readability and maintain consistency, renaming columns is a good practice:
df.rename(columns={'old_name': 'new_name', 'another_old': 'another_new'}, inplace=True)You can also apply formatting rules to all column names. Run this command to convert column names to lowercase and replace spaces with underscores:
df.columns = df.columns.str.lower().str.replace(' ', '_')5. Saving Cleaned Data
After completing the data cleaning process, it is essential to save the cleaned dataset for further analysis or sharing. Let’s take a closer look at different methods to export cleaned data and best practices for saving and documenting it.
5.1 Exporting to CSV
The most common format for storing structured data is CSV. You can save your cleaned dataset using Pandas:
df.to_csv("cleaned_data.csv", index=False)5.2 Exporting to Excel
If you need to work with Excel files, you can save the data in XLSX format:
df.to_excel("cleaned_data.xlsx", index=False)5.3 Saving to a Database
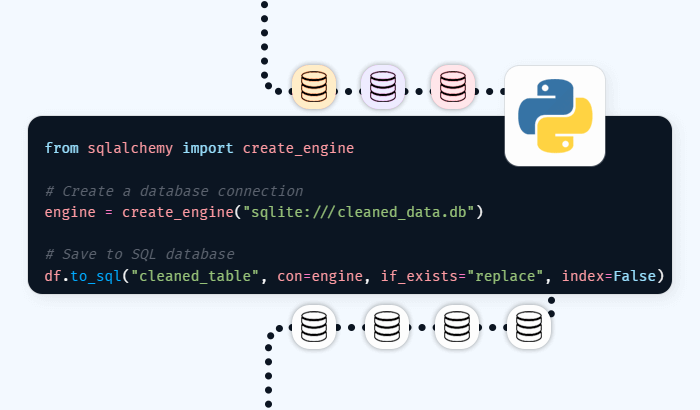
For large datasets or long-term storage, saving data to a database is a good option:
from sqlalchemy import create_engineCreate a database connection:
engine = create_engine("sqlite:///cleaned_data.db")Save to SQL database:
df.to_sql("cleaned_table", con=engine, if_exists="replace", index=False)5.4 Best Practices for Saving Data
- Choose the right format: Use CSV for simplicity, Excel for business reports, and databases for large-scale storage.
- Include metadata: Document data-cleaning steps and transformations applied.
- Ensure data integrity: Verify that all necessary columns and values are retained.
- Use consistent naming conventions: File names should be clear and descriptive (e.g., cleaned_data_2025.csv).
Frequently Asked Questions
Data cleaning ensures the accuracy, consistency, and reliability of your dataset, preventing incorrect analysis and misleading conclusions. Clean data leads to better decision-making, improved machine learning models, and more efficient business strategies.
You can remove missing values, impute them using mean/median/mode, or use forward and backward filling techniques. The best approach depends on the dataset and the impact of missing values on analysis.
Common techniques include handling missing values, removing duplicates, correcting inconsistencies, normalizing data, and transforming categorical data into numerical formats.
Python libraries like Pandas and NumPy allow you to automate repetitive cleaning tasks using scripts. You can also use workflow automation tools such as Apache Airflow for larger-scale data processing.
Choose CSV for general use, Excel for business reporting, and databases for long-term storage and large datasets. Ensure metadata and documentation are included for clarity.


