Article content

Tatiana Filippova
8 min read
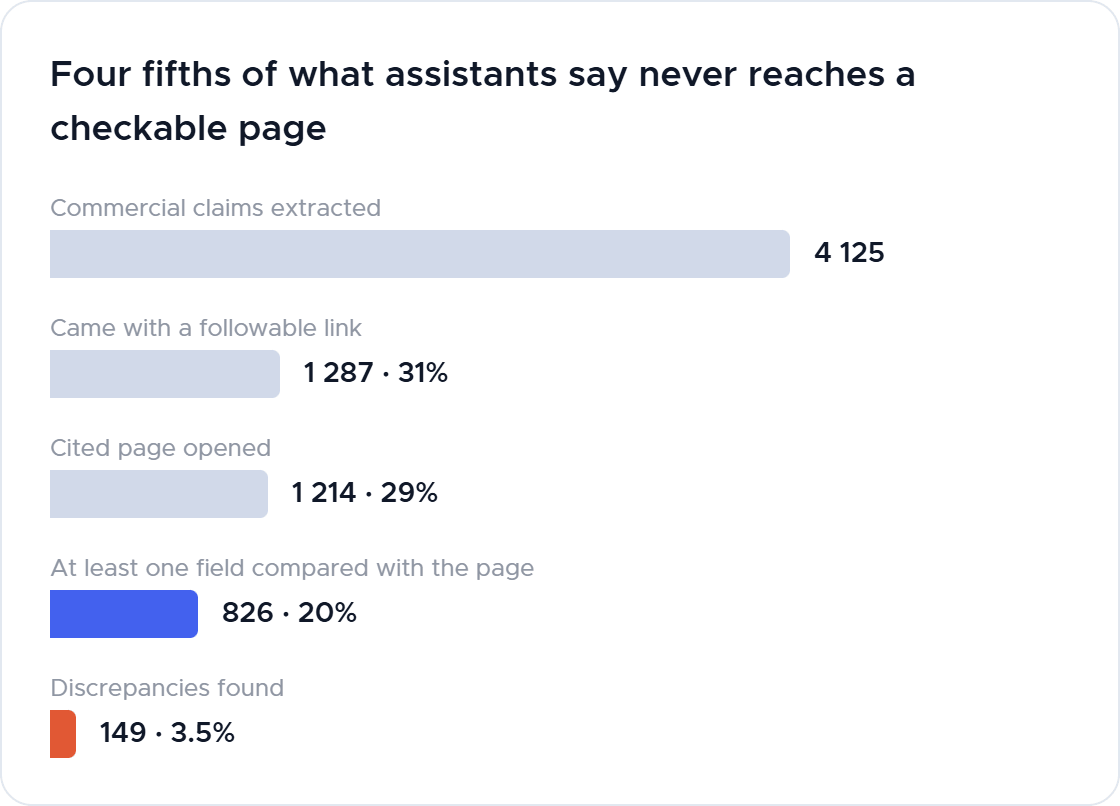
We took 4,125 commercial claims ("Product X is sold by retailer Y for price Z”) made by ChatGPT, Gemini and Perplexity, and went to the page each one cited. In two thirds of claims, the assistant named a seller without providing a followable link. For only 826 claims could we compare at least one field with the cited page. This means that assistants influence purchase decisions but often provide no direct link to the seller. The shopper’s next step may not be visible in your analytics.
Who this report is for
For e-commerce and channel leads at consumer brands who are responsible for how their products appear before shoppers reach a product page, and for the analysts and agencies supporting them.
This report takes no view on whether AI assistants are good or bad for your category. It assumes only that a growing share of purchase decisions now starts inside an answer you did not write, and that you would rather measure that than guess at it.
The full report will help you:
- identify the two metrics that describe your exposure;
- decide which of your systems to fix first;
- identify which shopper question is most likely to prompt a competing-product recommendation;
- recognize which findings are not yet reliable enough to guide decisions.
Four fifths of the claims could not be verified against the cited pages
Every one of our fourteen prompts asked for a direct product link. In 65% of claims the assistant named a seller and gave none, and 96% of those quoted a specific price anyway. The shopper is handed something precise enough to act on and no way to act on it.
Purchase intent is created and not routed. The shopper leaves with a store name and a number in their head, and nothing you own records where they went next.
The trap. A brand auditing its own AI answers starts with the answers that contain links, because those are the checkable ones. That is 31% of the sample; because link rates vary threefold across assistants, an audit based only on linked claims will overrepresent some assistants.
Ten things this data changes
1. Report two numbers, never one. Verifiable share is how much of what an assistant says can be compared with a live page at all. That is your observability. Agreement rate is how much of that comparable part is right. That is your data quality. Report both metrics separately for each assistant. An agreement rate computed on a fifth of your claims describes a fifth of your exposure. While verifiable share is low, spend on visibility, not accuracy: moving agreement from 79% to 85% changes almost nothing a shopper sees.
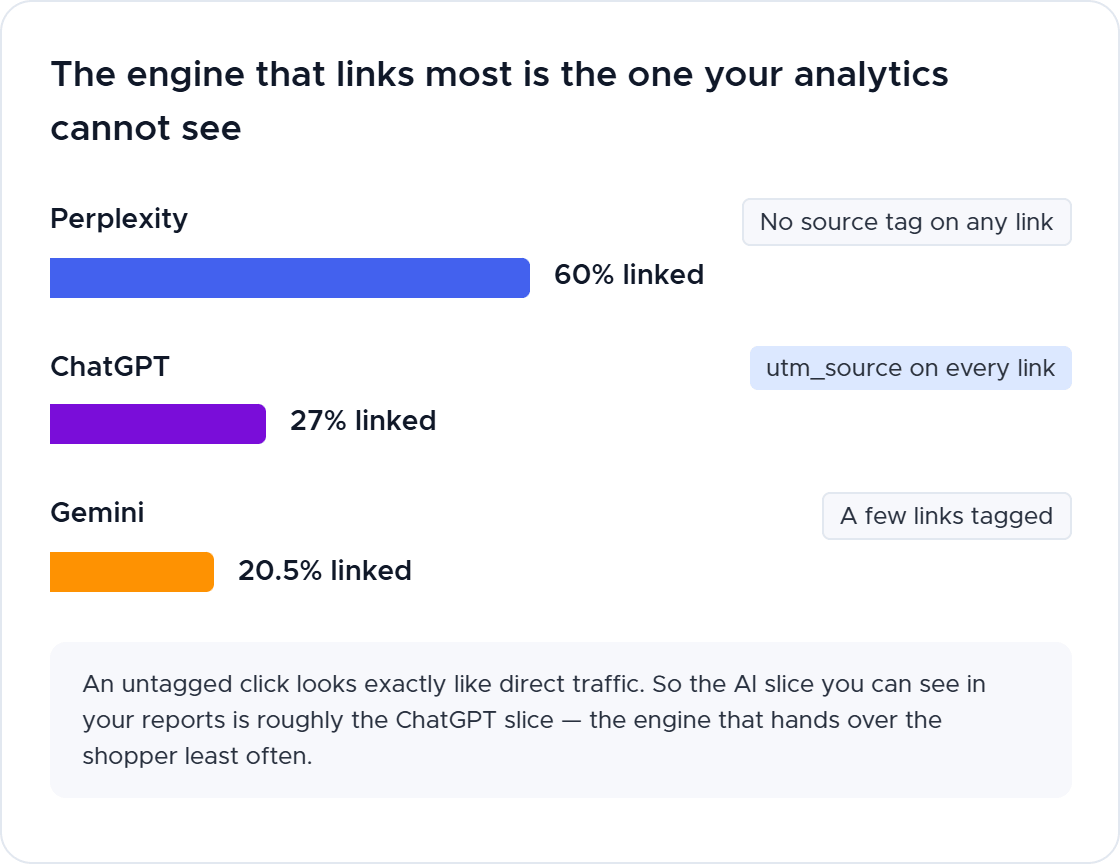
2. Which assistant the shopper uses decides whether you are visible at all. Perplexity links out three times as often as Gemini — 60% against 20.5%, ChatGPT 27% — and on the 102 questions all three answered, the same pattern appears in the 102 questions answered by all three: 62% for Perplexity, 31% for ChatGPT and 19% for Gemini. Worse, the AI traffic you can see in analytics is mostly ChatGPT's: every ChatGPT link carried utm_source=chatgpt.com, none of Perplexity's carried any tag. So the visible slice of the AI channel is the engine that links least, while the one sending the most clickable traffic is the one that is hardest to attribute from tags alone.
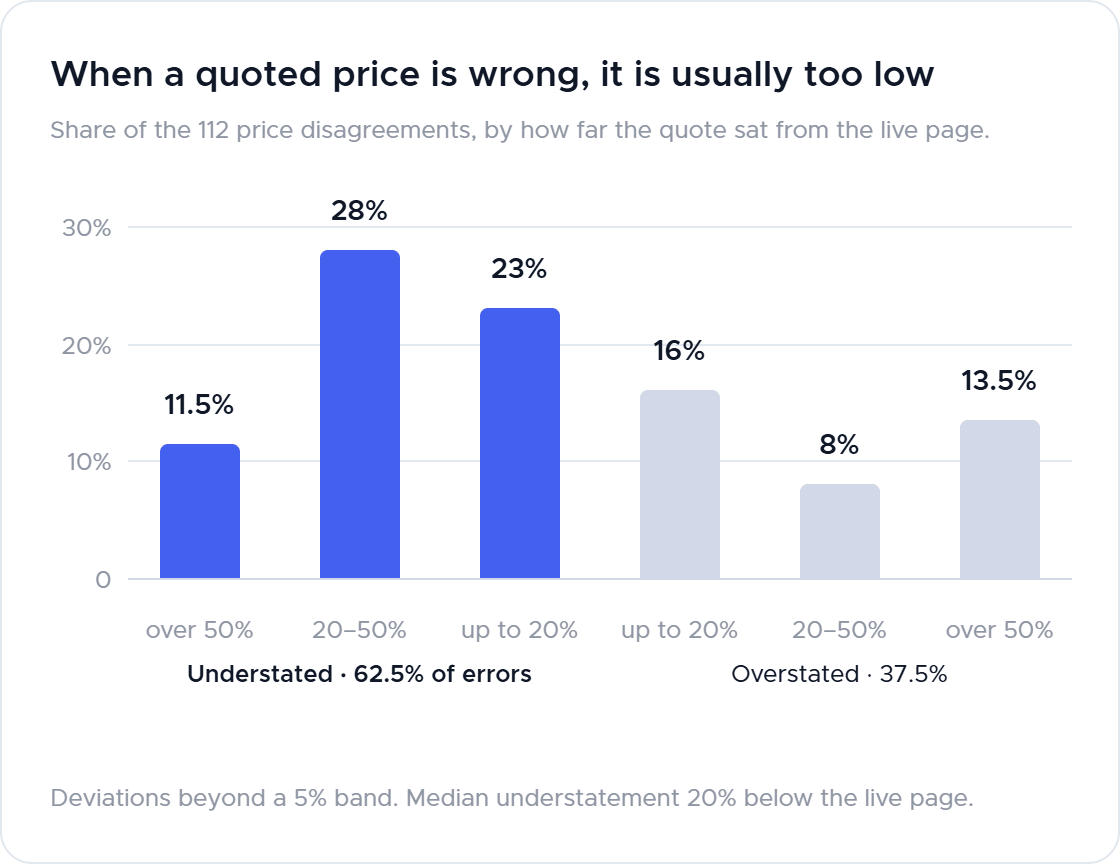
3. When discrepancies occur, they skew toward lower prices and lower availability. Of 112 price disagreements, 62.5% understated the live page, median 20% low — and the shopper finds out at the checkout of a retailer who didn't make the mistake. Availability is more lopsided: an "in stock" claim is right 19 times out of 20, an "out of stock" claim is wrong 43% of the time. That second error leaves no trace in any report you own: the shopper doesn't click, doesn't land, and never appears.
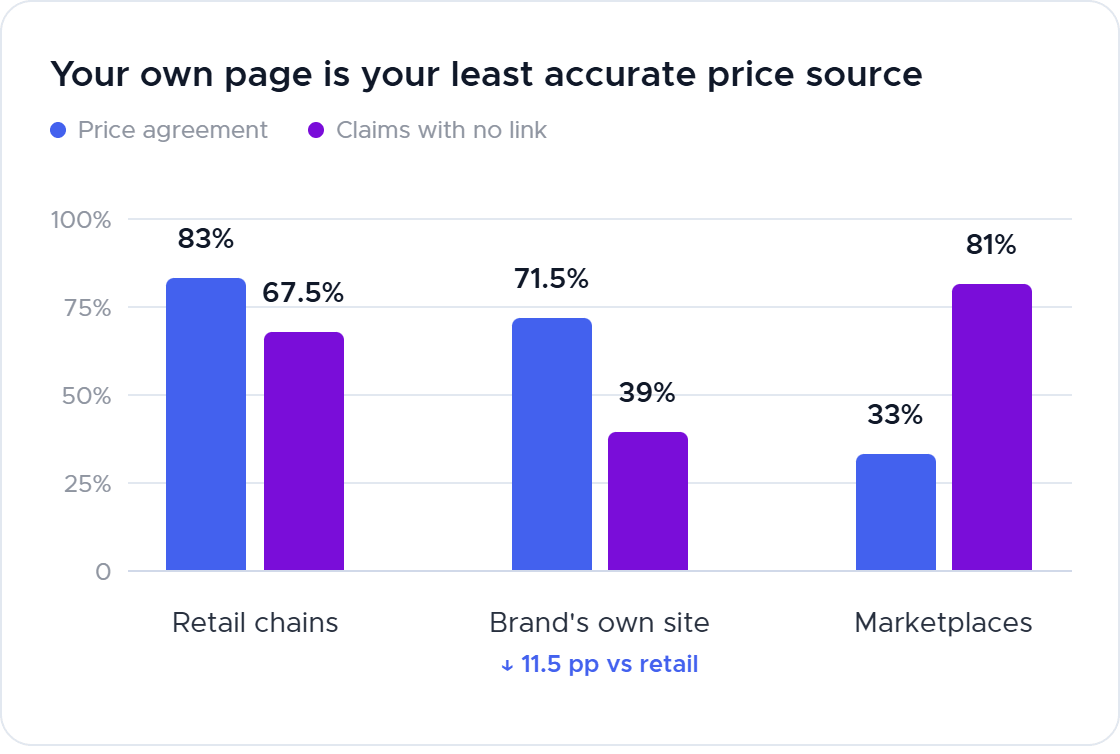
4. Your own site looks like the least accurate source of your own price — because that is where links land deepest. 71.5% agreement on your domain against 83% at retail chains, but 95% of the links to brand domains pointed three or more levels deep, against 44% for retail. Matched on depth the gap disappears: 72% against 69%. Better news than it sounds — it names the exact pages to fix.
5. Product substitution is rare in this sample, except on one question. Across 3,136 direct product claims, a rival manufacturer's product was named exactly once. The highest observed substitution rate occurred for one question: "Is there a cheaper alternative to X?", where 29% of answers named a rival. Treat that as a floor: we matched a fixed list of brand names, and no such list is complete. A significant share of claims did not allow product identity to be determined, so the denominator for any substitution rate is narrower than the total claim count.
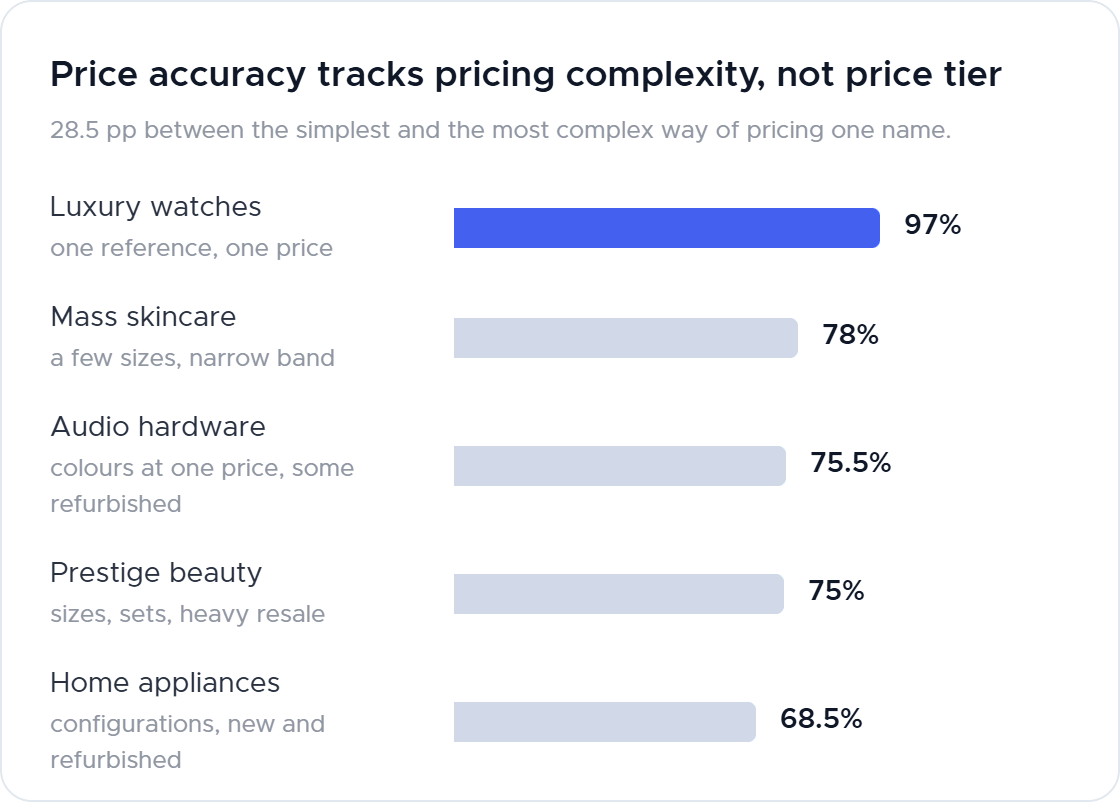
6. Price accuracy tracks how many legitimate prices one product name carries, not the category or the price tier. One product model with a single price: 97% agreement. Products with many variants and prices: 68.5%. One prestige face cream was quoted anywhere from £85 to £390 while the live pages ran from £26 to £465, both extremes on the brand's own site. There is no single price there for an assistant to get right.
7. How the shopper phrases the question decides whether you can see anything. Link rate runs from 50% for "which authorised stores sell X" down to 18% for "can I buy X on a marketplace", and no phrasing in this study links out more than half the time. The two groups of claims least likely to include a link, marketplaces and older or discounted units, are also the two worst on price accuracy: 78% and 58%. Hard to check, and pointed at the prices least likely to be right.
8. Treat a link as a claim, not as proof. About 4% of followable links resolved to a store's homepage with no product page at all, and a few more to pages that no longer exist. Every bare-homepage link came from a single assistant, and several pointed at the brand's own homepage instead of its product page.
9. A correct price is no evidence the assistant meant the right product. We ran a product-identity check and are excluding its rate from every conclusion here: it required the product name used in the assistant’s answer to appear consecutively on the page, so it scored "mens diver watch" and "diver watch" as different products. One thing survives that calibration problem: the rate was the same whether the price matched or not.
10. The errors repeat, which is the only reason fixing them is measurable. Eight distinct incorrect prices accounted for 23 of the 112 price disagreements, each reproduced two to six times across differently worded questions, and the largest concentrations sit on pages a brand or its named partners control. A one-off measurement shows the scale of the problem; only a repeated one tells you whether it is shrinking.
Recommended actions, in priority order
| Do this | Supporting evidence |
|---|---|
| Track verifiable share and agreement rate per engine; add "did it answer at all". We recommend against publishing a blended average. | Link rate varies threefold by engine; a blend hides both your best and worst case. |
| Consider discounting today's AI-visibility number by about 5% | That share of followable links resolved to a store homepage or a dead page. |
| Audit price markup, canonicals and stale duplicate pages on your own product pages. | Own-site agreement 71.5% vs 83% at retail; the same wrong number recurs up to six times. |
| Add a monthly "told out of stock while in stock" check on hero SKUs. | 20 of 25 stock errors ran that way — the only failure here that leaves no trace in your own data. |
| Consider splitting multi-price product names into distinct records, with the distinguishing detail in the title, the structured data and the canonical URL. | One name, one price: 97%. Wide matrix: 68.5%. Until the spread narrows, monitoring those SKUs may be measuring noise. |
| Publish a machine-readable authorised-seller list, and canonical pages for discontinued and refurbished lines. | "Which authorised stores sell X" is the best-addressed question at 50%; discontinued items and configuration matrices are the worst, 78–79% unlinked. |
| Check weekly what each assistant answers to "a cheaper alternative to X", per hero product, per market. | The only phrasing where substitution actually happens in this sample. Consider deprioritizing "AI brand hijacking" as a general threat in the risk register. |
Include questions that produce fewer links or less reliable answers in your monitoring. Whoever builds it will be tempted to use the questions that return clean, linked, parseable answers, because those make a working dashboard — and that guarantees a report about your best case. For each hero product include at least one marketplace question, one older-or-cheaper-version question and one "cheapest price" question, and track "answered but unverifiable" as an outcome in its own right instead of dropping those rows.
Produced on the Infatica Data Platform. Brand, product and retailer names are withheld throughout; categories and assistant names are reported as tested.
Study methodology and limitations
3,780 questions → 4,125 claims → 1,287 followable links → 826 claims with at least one field compared. A claim exists here only if the the it is explicitly supported by a direct quote from the assistant’s response: every record carries a verbatim evidence span containing the seller, the price digits and the stock wording, re-checked programmatically and discarded if it fails. Nothing here is a paraphrase of what an assistant probably meant, and the validation process excludes records that lack sufficient supporting evidence.
It measures disagreement between an answer and a page. It does not observe how an assistant selects a number, so every causal reading is interpretation, not a tested finding. It is a three-day snapshot reaching a fifth of claims, and makes no claim about the other four fifths. Marketplace accuracy rests on 21 comparisons — treat this as an indicative finding rather than a reliable estimate. One brand per category: the same patterns may occur elsewhere, but the percentages should not be assumed to apply to other brands or categories.
Disclaimer. This study reflects a limited sample of queries executed on 16–18 September 2026 and the content of web pages as available to the researchers at the time of checking. The results apply only to the queries, products, markets, service versions and configurations tested. Service responses, prices, product availability and page content may change, so a subsequent check may produce different results.
The conclusions of this report are the authors' interpretation of the data collected. A recorded discrepancy means only that an assistant's answer did not match the content of the corresponding page at the time of checking. It does not by itself establish the cause of the discrepancy, and it is not an assertion of any violation of law, contractual obligations, consumer rights or industry requirements on the part of a brand, a seller, a marketplace or the developer of the relevant service. Where a seller's status could not be confirmed through the open sources used, this does not mean that the seller is not authorized.